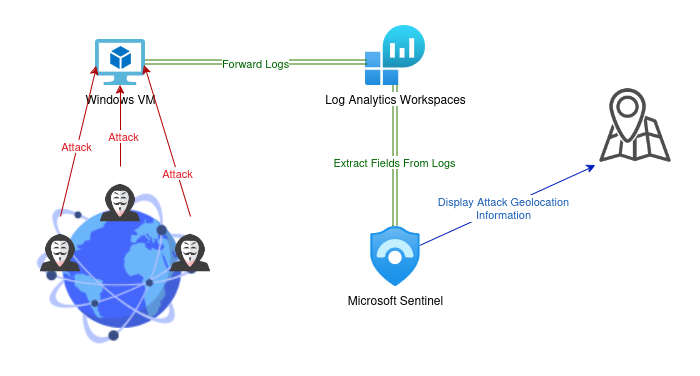
In this lab, I’ll walk you through the process of setting up a virtual machine (VM) honeypot in the Azure cloud. A honeypot is essentially a deliberately vulnerable machine with open ports, designed to attract potential attackers. It’s like sending an open invitation to the world. In this setup, I will monitor my VM using Azure Sentinel to track and map the locations of attackers attempting to break into the machine via RDP. This quick lab not only helps me get things up and running but also deepens my understanding of Azure Sentinel in the process.
Overview of the workflow
Walkthrough
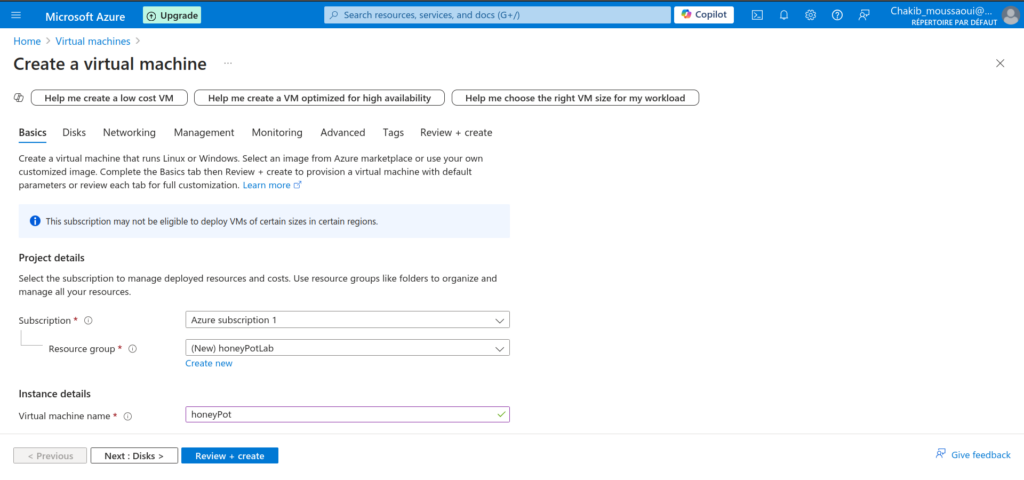
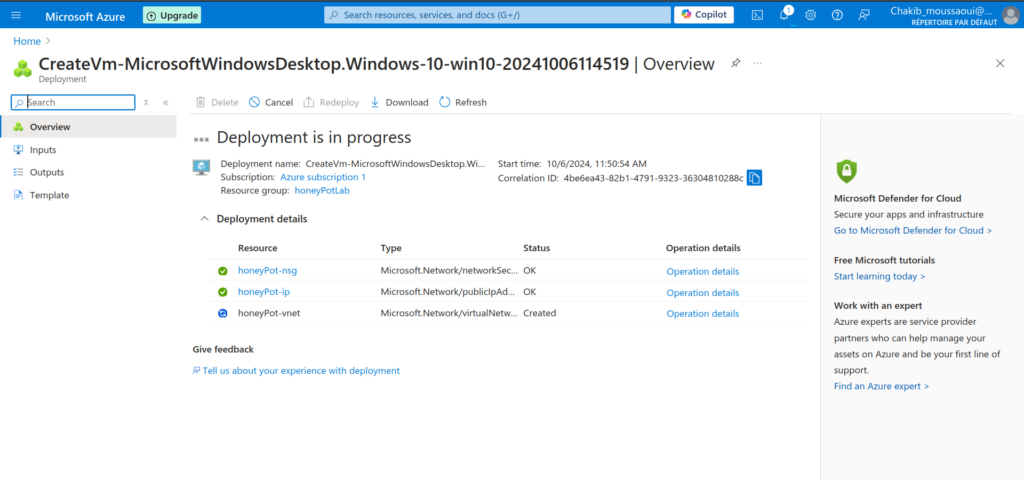
Allocating a virtual machine in Azure
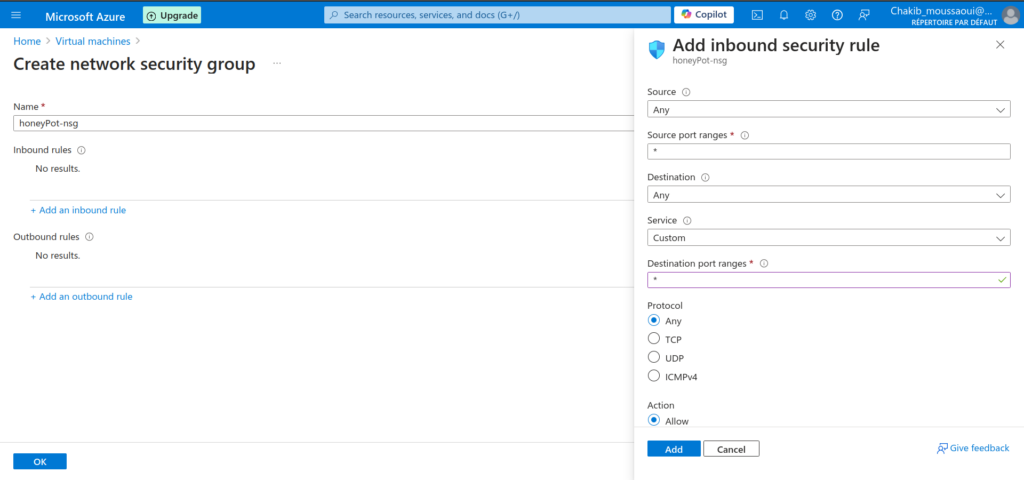
Creating a Network Security Group
In this section, I aimed to make my machine as vulnerable as possible. How do we achieve that? By opening all the ports. Bots are constantly scanning the internet for machines to break into, whether they belong to an organization or an individual. To expose my VM to potential attacks, I configured an inbound security rule in my firewall to accept requests from any IP address, regardless of the source or destination. This setup ensures my machine is as open and vulnerable as possible.
Creating a Log Analytics Workspace
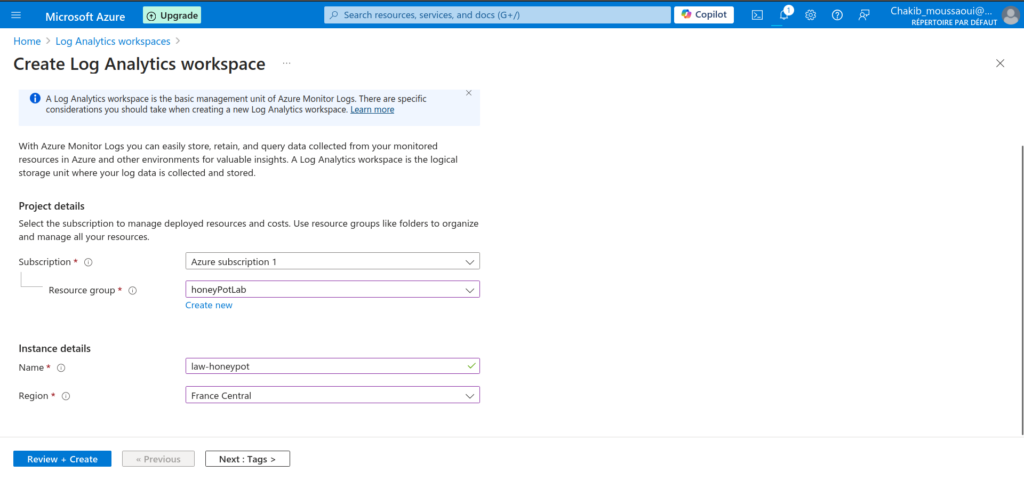
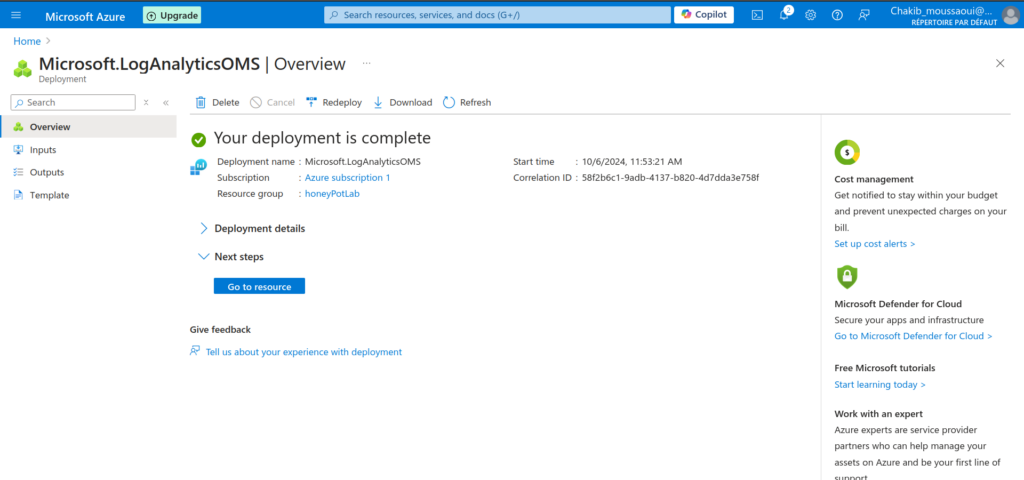
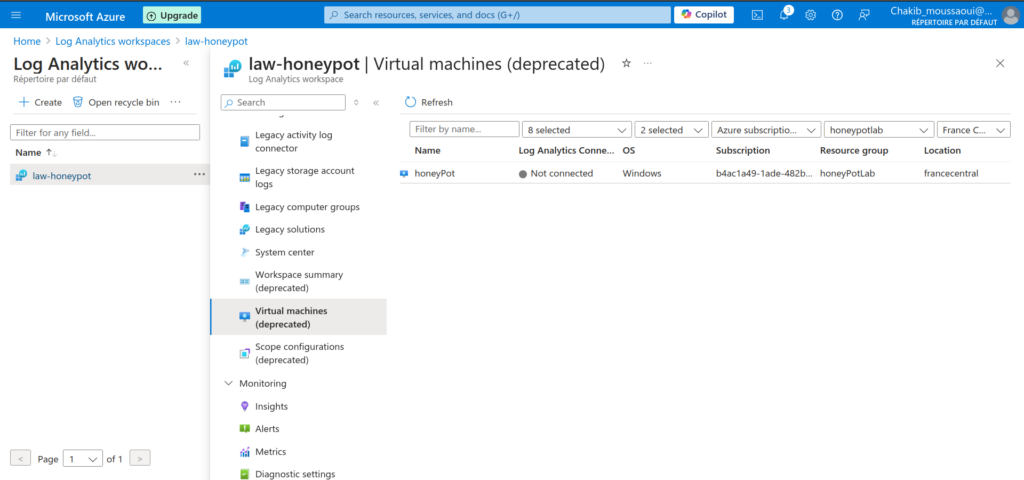
Next, I set up a Log Analytics workspace, a critical component for collecting, analyzing, and monitoring logs from the virtual machine. This workspace acts as the central hub for all the data generated by the VM, allowing for in-depth analysis of security events. By ingesting logs in real-time, Log Analytics helps detect suspicious activities, such as unauthorized login attempts or port scanning, which is vital when dealing with a vulnerable machine like the honeypot. Additionally, it integrates seamlessly with Azure Sentinel, enabling advanced threat detection and visualization of potential attacks on a customizable dashboard.
Microsoft Defender for Cloud
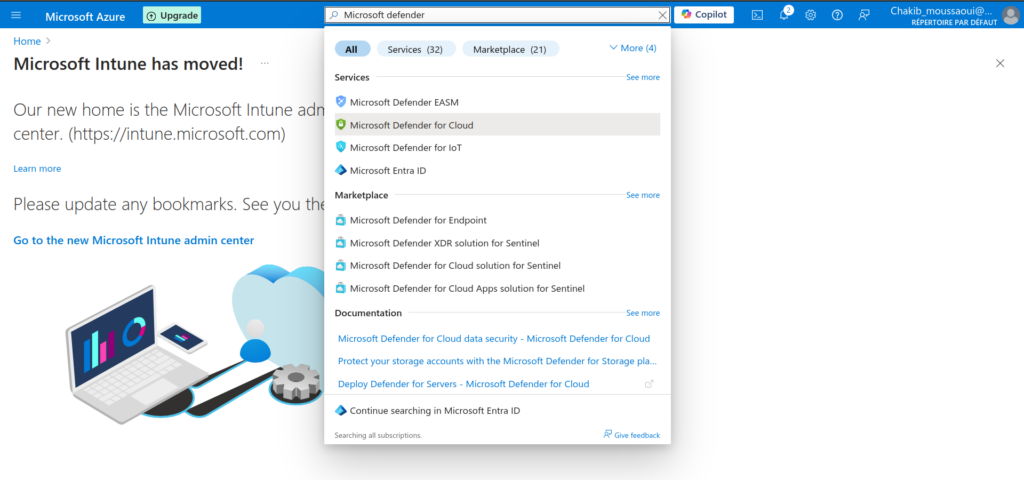
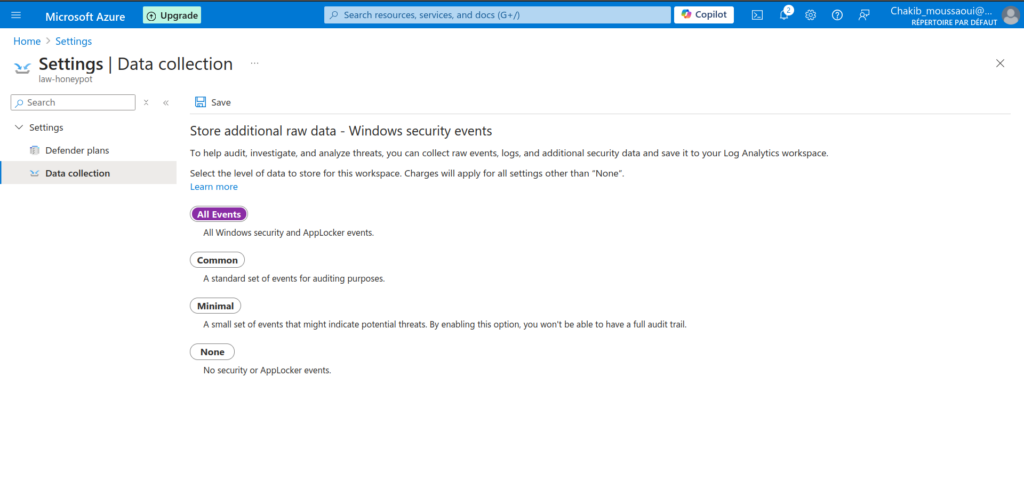
After setting up the basics, I moved on to Microsoft Defender for Cloud to enhance the security monitoring capabilities. I enabled the collection of all events, rather than just a subset of them, to ensure comprehensive visibility into my VM’s activity. Microsoft Defender for Cloud is a robust, built-in security solution within Azure that provides threat protection across cloud and hybrid environments. By enabling full event collection, I ensured that every security event, no matter how minor, would be logged and analyzed—helping to detect potential threats more effectively. This step not only strengthens the honeypot’s defenses but also allows for a richer dataset when investigating the tactics used by attackers.
Connecting to the Windows VM
Next, I connected to my Windows virtual machine using Remmina, a remote desktop client, since my operating system during this lab was Ubuntu. The experience was seamless. All you need to provide are the username, password, and IP address of the machine, and you’ll have full access to a visual Windows desktop environment.
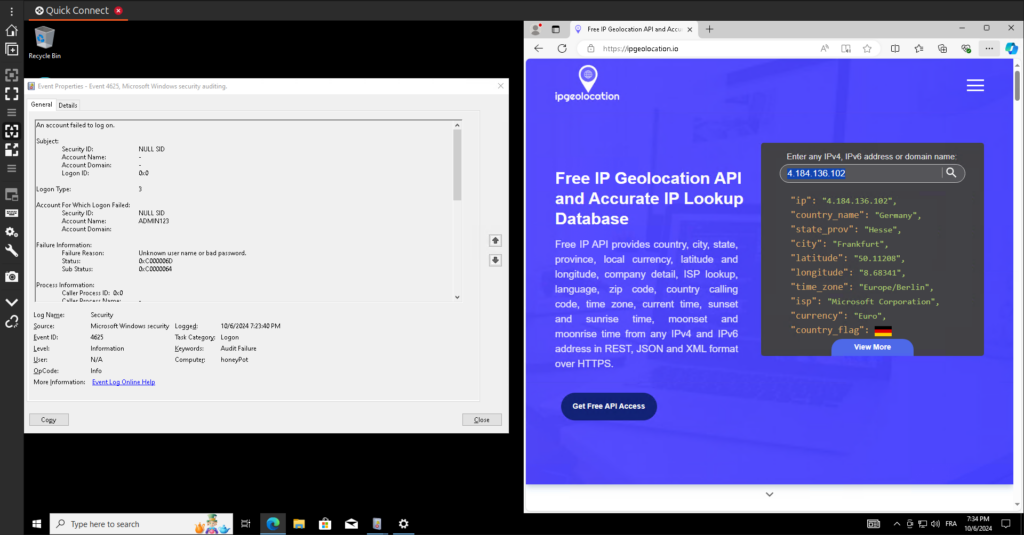
Once connected, one of the first steps I took was to open the Event Viewer, a crucial tool in Windows that every administrator should familiarize themselves with. The Event Viewer is where you can find all the system, application, and security events and logs generated by the machine. These logs offer invaluable insight into how the system is operating and whether there have been any attempted security breaches or system errors.
Exploring Windows Security Logs
Now comes the fun part—what we’ll actually be working with: the logs located under Windows Logs > Security. These logs record critical events such as Audit Success and Audit Failure, which are tied to RDP login attempts. Each log entry contains valuable fields like date and time, source, event ID, and task category, providing a detailed snapshot of what’s happening on the machine.
The most important piece of information for our analysis is the IP address, which is included in the event properties. This is the key data we’ll use to identify where the login attempts are originating from. By extracting these IP addresses, we can leverage a third-party IP geolocation tool to map out the locations of the attackers, giving us insights into who is trying to access the machine and from where.
Disabling the Firewall on the Machine
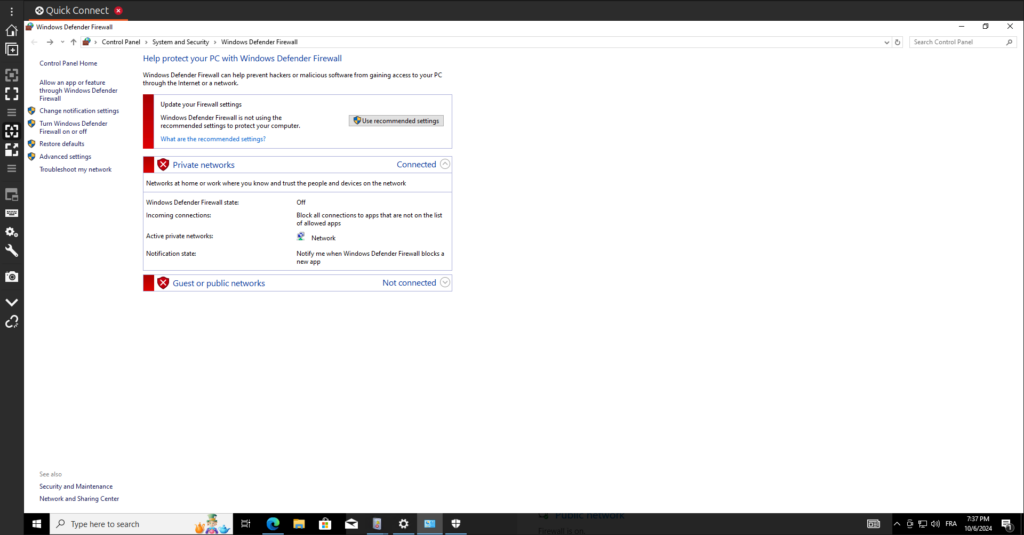
As I mentioned earlier, the goal of setting up a honeypot is to create a deliberately vulnerable machine. To further reduce the security defenses, I navigated to the Windows Defender Firewall settings on my virtual machine and disabled it completely. While Windows will generate security warnings about the risks, these can be safely ignored in this context since the purpose is to invite potential attacks. Disabling the firewall ensures that all inbound connections, including malicious ones, can reach the VM without being blocked, making it an ideal target for attackers scanning the network.
Verifying Machine Vulnerability
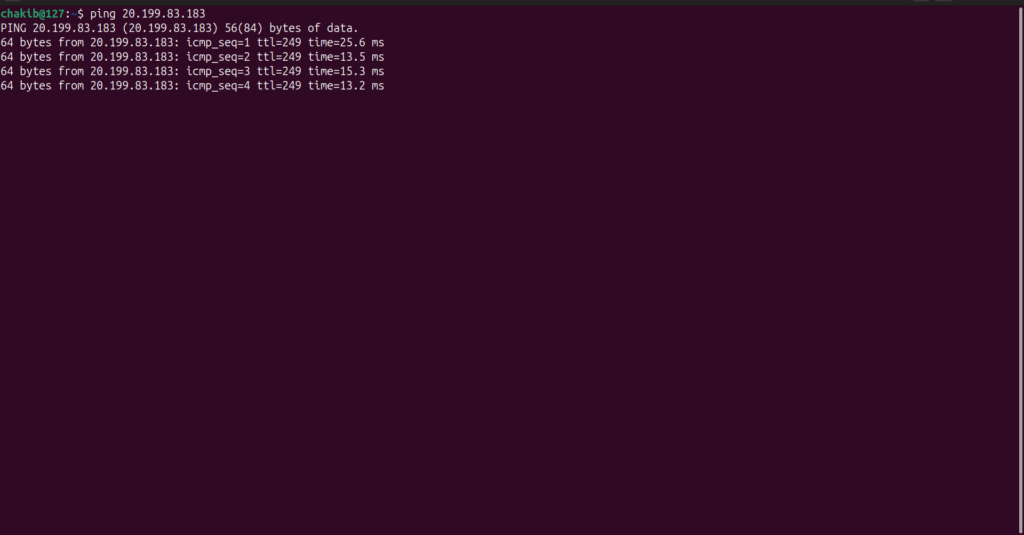
To confirm that the machine is truly “vulnerable,” you can perform a simple test by pinging it from your own system, as I did in the lab. A successful ping response is clear evidence that the machine is accepting ICMP (Internet Control Message Protocol) requests, indicating that the firewall has indeed been disabled and the VM is open to inbound traffic. This basic test helps verify that the machine is exposed, ready to attract unwanted attention from bots or malicious actors scanning the network.
PowerShell Script for Monitoring Failed RDP Login Attempts
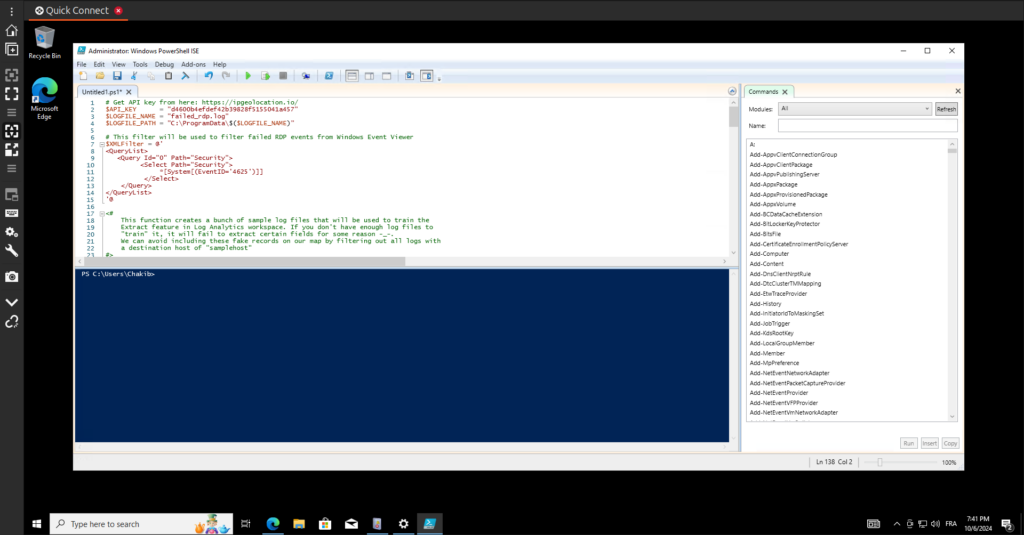
To enhance the functionality of our honeypot and analyze failed RDP login attempts, I wrote a PowerShell script that accomplishes several tasks. Below is a breakdown of the script’s key components:
API Key and Log File Setup
# Get API key from here: https://ipgeolocation.io/
$API_KEY = "d460xxxxxxdef42bxxxxxxxxxxxxxx"
$LOGFILE_NAME = "failed_rdp.log"
$LOGFILE_PATH = "C:\ProgramData\$($LOGFILE_NAME)"
The script begins by defining the API key needed for geolocation services and sets the log file name and path. This log file will store data about failed RDP login attempts.
Event Query Filter
# This filter will be used to filter failed RDP events from Windows Event Viewer
$XMLFilter = @'
<QueryList>
   <Query Id="0" Path="Security">
         <Select Path="Security">
              *[System[(EventID='4625')]]
          </Select>
    </Query>
</QueryList>
'@
An XML query is defined to filter out failed login attempts. The specific Event ID 4625 corresponds to failed RDP logon events.
Sample Log Generation
Function write-Sample-Log() {
    # Generates sample logs for training Log Analytics
    "latitude:47.91542,longitude:-120.60306,destinationhost:samplehost,username:fakeuser,sourcehost:24.16.97.222,state:Washington,country:United States,label:United States - 24.16.97.222,timestamp:2021-10-26 03:28:29" | Out-File $LOGFILE_PATH -Append -Encoding utf8
    # Additional sample log entries...
}
The function write-Sample-Log generates sample log entries for training purposes in Log Analytics. These entries are appended to the log file, but are filtered out during the actual data collection process.
Log File Creation
if ((Test-Path $LOGFILE_PATH) -eq $false) {
    New-Item -ItemType File -Path $LOGFILE_PATH
    write-Sample-Log
}
This block of code checks if the log file exists; if not, it creates it and populates it with sample data.
Continuous Monitoring Loop
while ($true)
{
    Start-Sleep -Seconds 1
    $events = Get-WinEvent -FilterXml $XMLFilter -ErrorAction SilentlyContinue
    # Additional processing...
}
An infinite loop continuously checks the Windows Event Viewer for new failed login events, allowing real-time monitoring.
Processing Events and Geolocation
foreach ($event in $events) {
    if ($event.properties[19].Value.Length -ge 5) {
        # Extract relevant details
        $timestamp = $event.TimeCreated
        $sourceIp = $event.properties[19].Value
        # Make geolocation API request
        $API_ENDPOINT = "https://api.ipgeolocation.io/ipgeo?apiKey=$($API_KEY)&ip=$($sourceIp)"
        $response = Invoke-WebRequest -UseBasicParsing -Uri $API_ENDPOINT
        # Write to log
        "latitude:$($latitude),longitude:$($longitude),..." | Out-File $LOGFILE_PATH -Append -Encoding utf8
    }
}
Each event is processed to extract the source IP address and other details. A web request is made to the geolocation API to retrieve location data, which is then logged for future analysis.
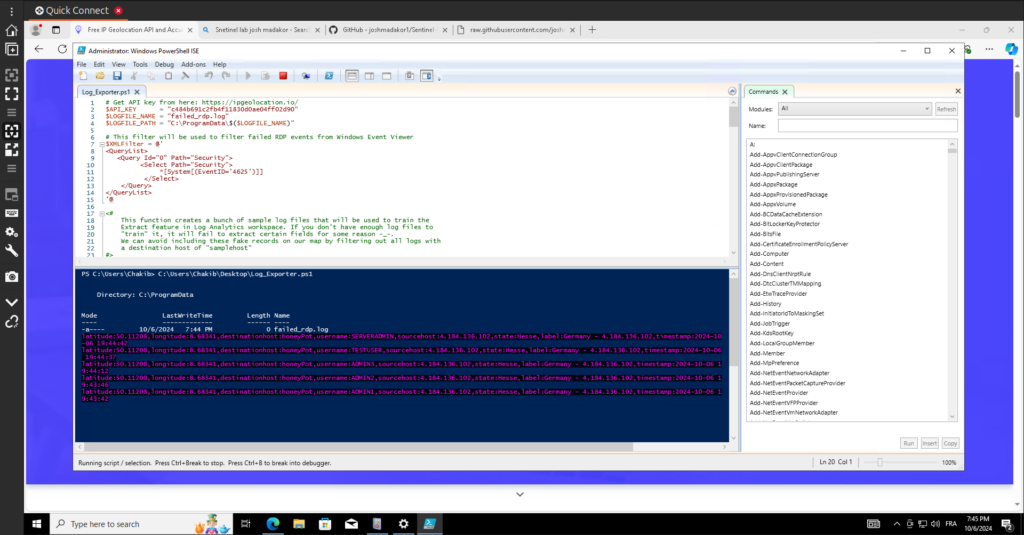
Accessing the Log File
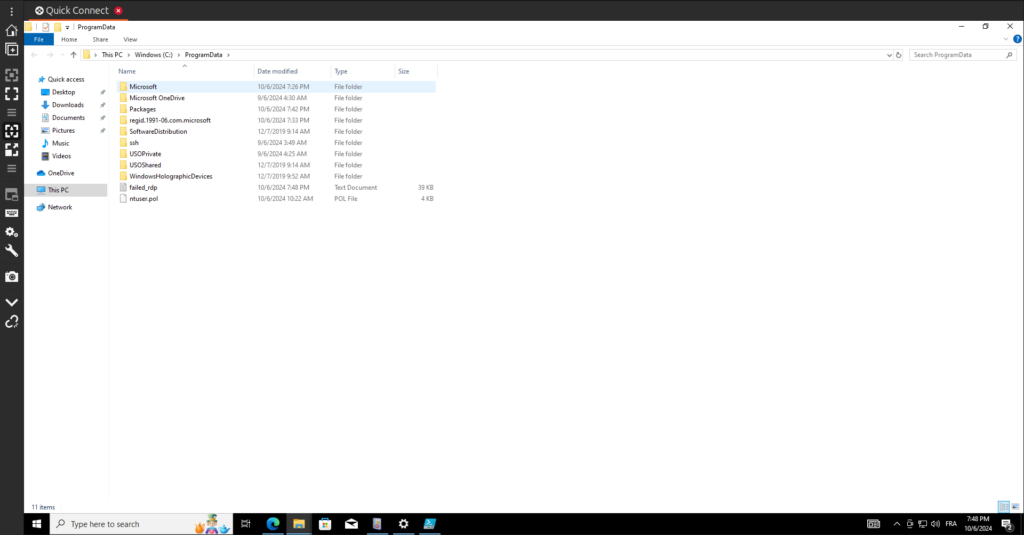
After running the script, the log file containing details of failed RDP login attempts is created at the following path:
C:\ProgramData\failed_rdp.logt’s important to note that the ProgramData folder is hidden by default in Windows. To access this directory:
- Open the Run Dialog:
- Press
Win + Ron your keyboard.
- Press
- Type the Path:
- In the Run dialog, type
C:\ProgramDataand pressEnter.
- In the Run dialog, type
- View Hidden Files:
- If you still don’t see the log file, you may need to adjust your folder options to view hidden files:
- Open File Explorer.
- Click on the View tab in the ribbon.
- Check the Hidden items checkbox to display hidden files and folders.
- If you still don’t see the log file, you may need to adjust your folder options to view hidden files:
Once you access the ProgramData directory, you can find the failed_rdp.log file and review its contents for valuable insights into failed login attempts.
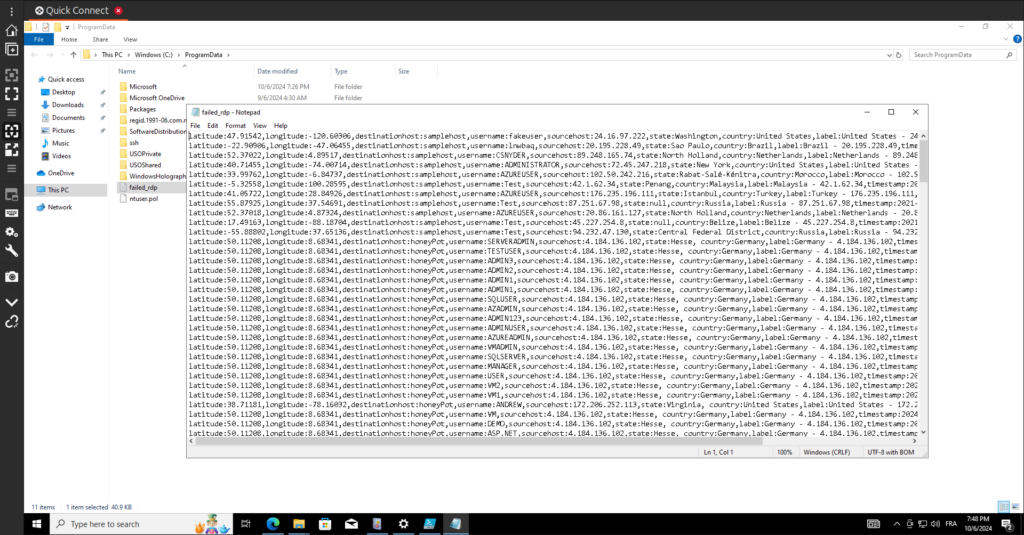
Creating a Custom Log
Now that we have the log file on our Windows VM, it’s time to configure the Log Analytics workspace to monitor for failed RDP login attempts using the data from the file. Here’s how to do it:
- Navigate to Log Analytics Workspace:
- Open the Azure portal and head to Dashboard.
- Click on Log Analytics workspaces and select your workspace, named
law-honeypotlab.
- Create a New Custom Log:
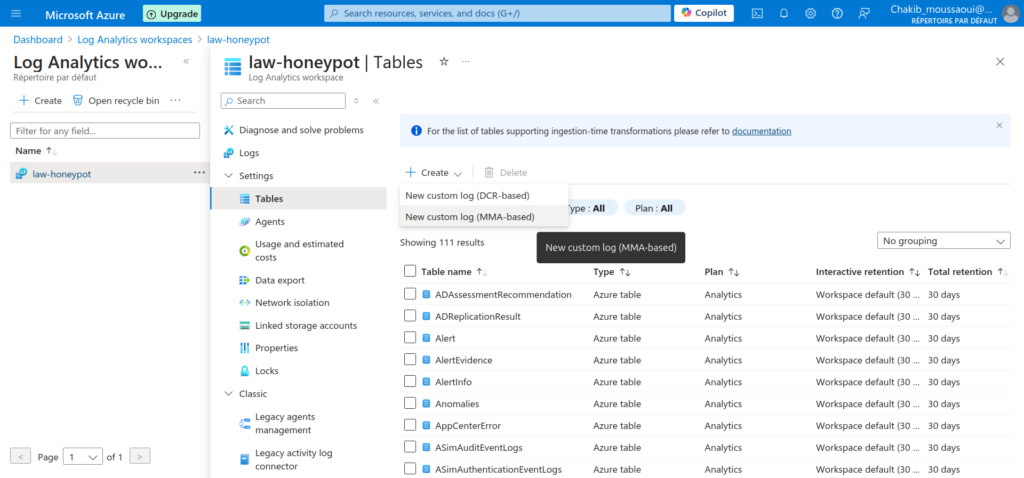
- Under the Tables section, click on New Custom Log (MMA based). This will allow you to define a new log source for monitoring.
- Specify the Log File Location:
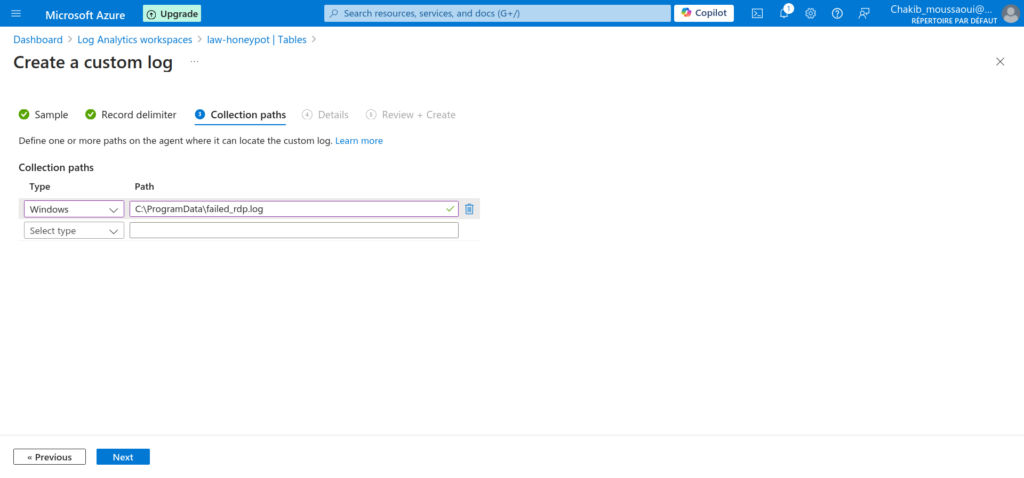
- In the configuration settings, specify the path to your log file as
C:\ProgramData\failed_rdp.log. This tells Log Analytics where to look for the data.
- In the configuration settings, specify the path to your log file as
- Add Sample Log Entries:
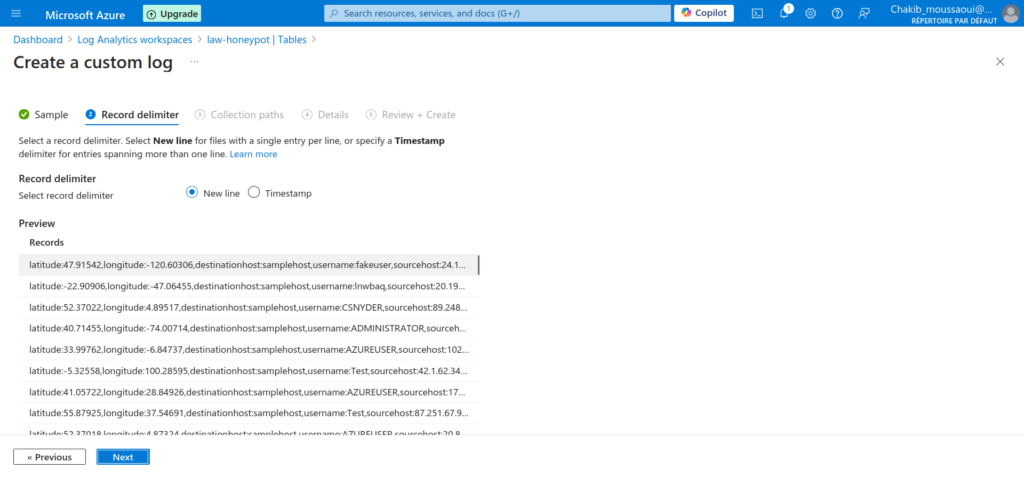
- To help the Log Analytics workspace understand the structure of your log, open the
failed_rdp.logfile on your Windows VM using a text editor. - Copy some sample entries from the log file into the custom log configuration. This provides a reference for the fields present in your log, ensuring accurate data ingestion and analysis.
- To help the Log Analytics workspace understand the structure of your log, open the
By following these steps, your Log Analytics workspace will be set up to actively monitor the log file for failed RDP login attempts, helping you to analyze and respond to potential security threats effectively.
Extracting Important Fields Using KQL Queries
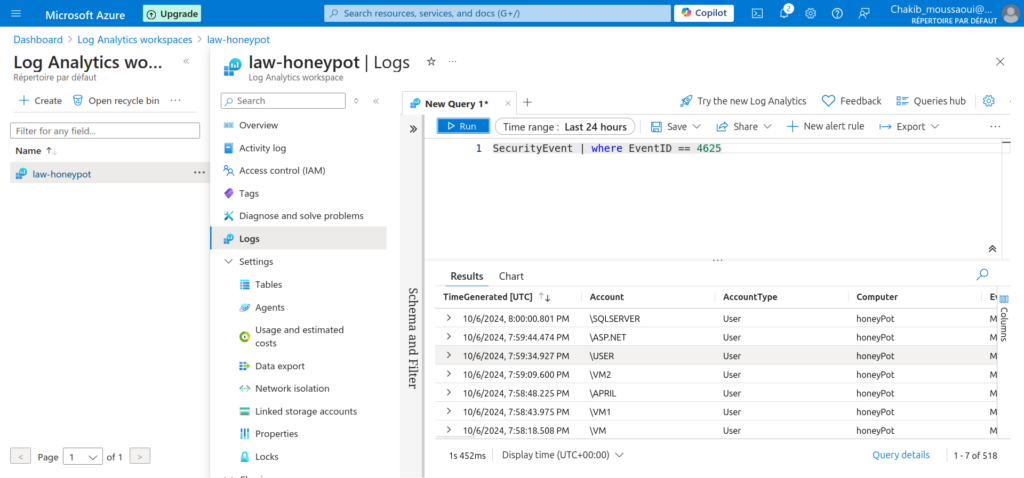
Next, I ran some queries to ensure everything was functioning correctly with the log ingestion process. First, I verified that my VM was successfully forwarding the basic logs before checking for the recognition of our custom log. To do this, I executed the following KQL query:
SecurityEvent | where EventID == 4625This query filters the SecurityEvent table to display only events with the Event ID 4625, which corresponds to audit login failures. By running this query, I was able to confirm that the failed RDP login attempts were being logged correctly in the system.
Once I verified the basic log ingestion, I proceeded to check if the custom log we created was also being recognized by the Log Analytics workspace. This step was crucial for ensuring that our monitoring setup was comprehensive and that we could accurately track and analyze potential security threats to our honeypot.
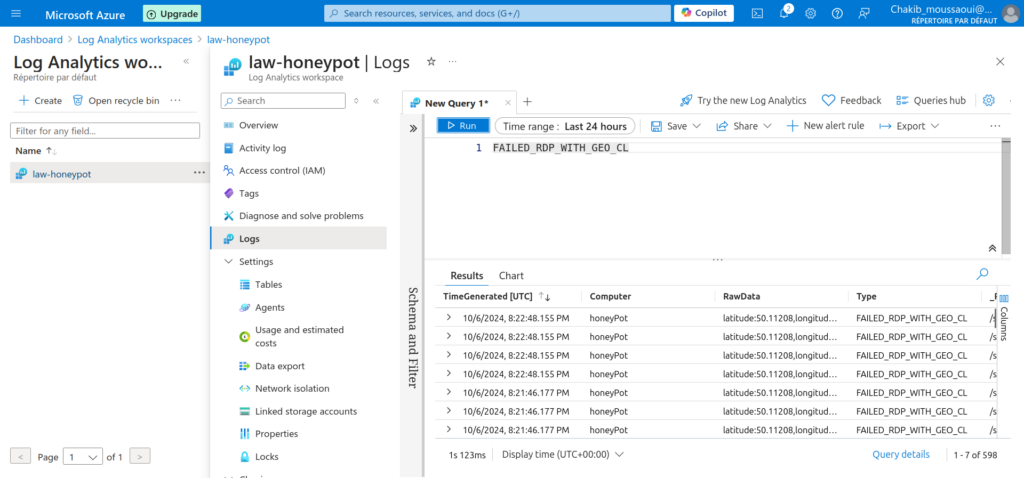
Extracting Fields from Custom Logs Using KQL Queries
To extract essential fields from our custom log, I used the following KQL query to parse the FAILED_RDP_WITH_GEO_CL table. This query efficiently retrieves geolocation data and other relevant information from the logs:
FAILED_RDP_WITH_GEO_CL
| extend latitude = extract("latitude:([0-9.-]+)", 1, RawData)
        , longitude = extract("longitude:([0-9.-]+)", 1, RawData)
        , destinationhost = extract("destinationhost:([^,]+)", 1, RawData)
        , username = extract("username:([^,]+)", 1, RawData)
        , sourcehost = extract("sourcehost:([^,]+)", 1, RawData)
        , state = extract("state:([^,]+)", 1, RawData)
        , country = extract("country:([^,]+)", 1, RawData)
        , label = extract("label:([^,]+)", 1, RawData)
        , timestamp = extract("timestamp:([^,]+)", 1, RawData)
| project TimeGenerated, Computer, latitude, longitude, destinationhost, username, sourcehost, state, country, label, timestamp
This query uses the extend operator to create new columns by extracting specific data points from the RawData field. Each extract function targets a different piece of information: latitude, longitude, destination host, username, source host, state, country, label, and timestamp.
The project operator is then employed to display the relevant columns, including TimeGenerated and Computer, alongside our extracted fields. This structured output not only helps in visualizing the data but also aids in identifying patterns or trends related to failed RDP login attempts.
Running this query allowed me to confirm that the data extraction was successful and that we could leverage this information for further analysis and reporting. Understanding the geographic location of the attempted logins provided valuable insights into potential threats and allowed for more informed decision-making in enhancing our security posture.
Creating a workbook in sentinel
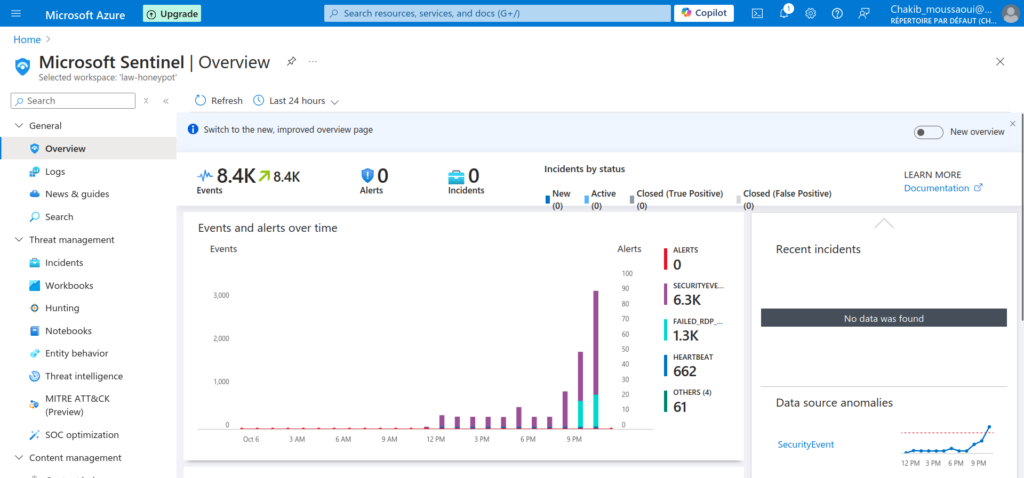
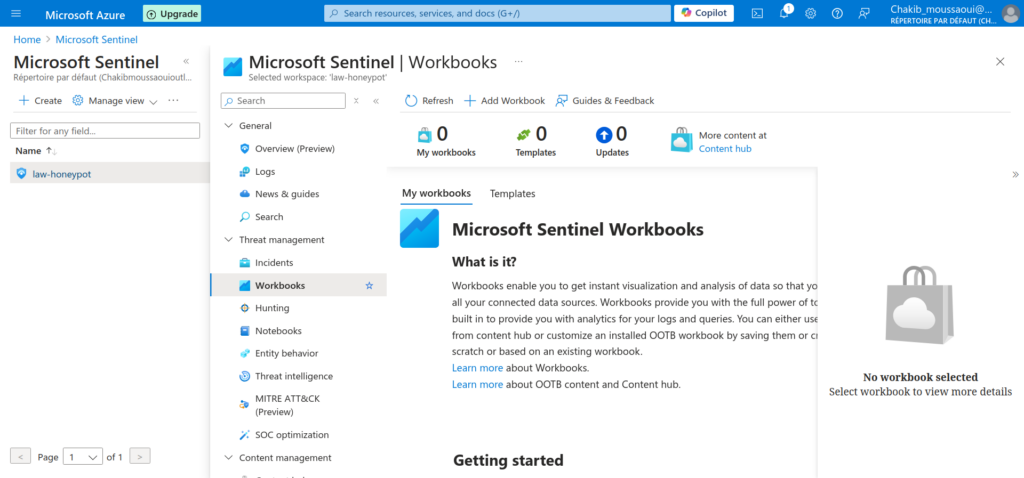
Next, I navigated to Microsoft Sentinel and clicked on the Workbooks section. Before proceeding, it’s crucial to ensure that Microsoft Sentinel is properly linked to our Log Analytics Workspace. Without this connection, the workbook won’t function correctly, as it relies on data ingested into the workspace.
Upon entering the Workbooks interface, I was presented with an overview of the ingested events. Notably, I observed 8.4 thousands events, predominantly consisting of security events. This metric indicates a significant volume of activity, highlighting the importance of continuous monitoring and analysis for potential threats.
Creating a workbook provides an interactive platform for visualizing and analyzing this data. It allows us to tailor dashboards and reports based on specific needs, such as tracking failed RDP login attempts or identifying unusual patterns in user activity.
The workbooks in Microsoft Sentinel are highly customizable, enabling the inclusion of various visual elements such as charts, tables, and graphs. This flexibility is essential for deriving actionable insights from our security data and enhancing our incident response capabilities.
Running Queries in the Workbook
Next, we executed a query in our workbook to analyze the ingested logs. This query builds on the previous one by incorporating a summarization component to aggregate our results. The full query is as follows:
FAILED_RDP_WITH_GEO_CL

| extend latitude = extract("latitude:([0-9.-]+)", 1, RawData),

         longitude = extract("longitude:([0-9.-]+)", 1, RawData),

         destinationhost = extract("destinationhost:([^,]+)", 1, RawData),

         username = extract("username:([^,]+)", 1, RawData),

         sourcehost = extract("sourcehost:([^,]+)", 1, RawData),

         state = extract("state:([^,]+)", 1, RawData),

         country = extract("country:([^,]+)", 1, RawData),

         label = extract("label:([^,]+)", 1, RawData),

         timestamp = extract("timestamp:([^,]+)", 1, RawData)

| project TimeGenerated, Computer, latitude, longitude, destinationhost, username, sourcehost, state, country, label, timestamp

| summarize event_count=count() by sourcehost, latitude, longitude, country, label, destinationhost
In this query, we first extract various fields from the raw log data, including latitude, longitude, destination host, username, source host, state, country, label, and timestamp. This extraction helps in breaking down the log entries into more manageable and insightful components.
The key addition here is the summarize clause, which aggregates the log entries based on the source host, latitude, longitude, country, label, and destination host. By counting the number of events for each unique combination of these fields, we gain insights into:
- Event Count: This indicates how many failed RDP login attempts originated from each source host.
- Geolocation Data: The latitude and longitude provide context on where these login attempts are occurring geographically.
- Country Information: Identifying the countries from which the attempts are made can help in assessing the threat landscape.
This aggregated data is instrumental in visualizing potential security threats and understanding patterns in unauthorized access attempts. By analyzing this information, we can make informed decisions about improving our security posture and possibly blocking malicious IP addresses based on their geographic origins.
Visualizing Query Output on a Map
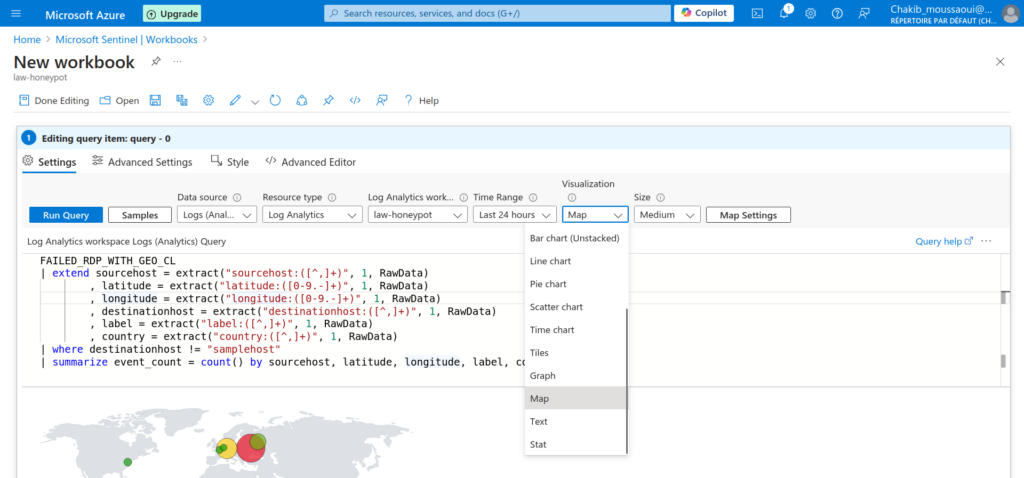
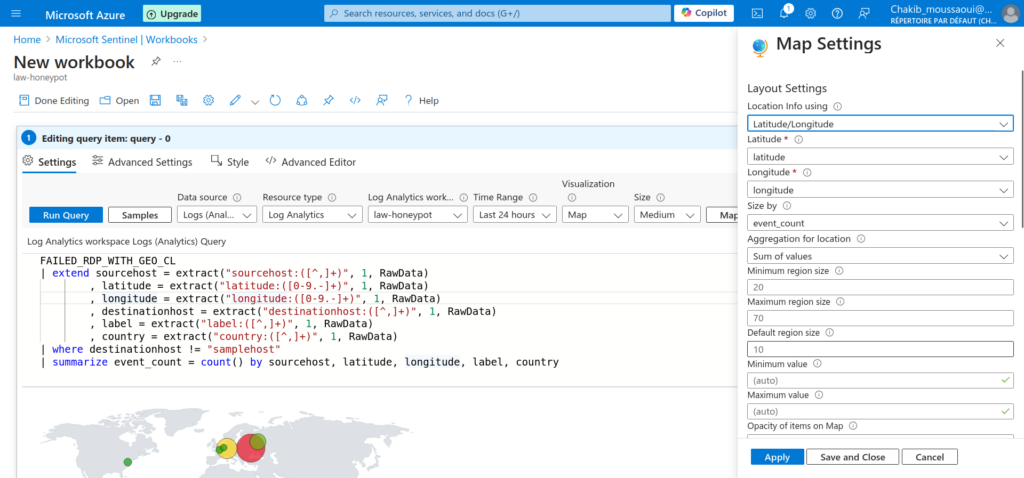
Once we have written and executed our query, the next step is to visualize the output effectively. To do this, we can use the map visualization feature in Microsoft Sentinel. Here’s how to proceed:
Event Count Representation: Decide how you want to represent the event counts on the map (e.g., using markers, heat maps, etc.). This helps in visualizing the intensity of failed login attempts from different locations.
Access Visualization Options: After running your query, locate the Visualization drop-down menu in the workbook interface. This menu allows you to choose different ways to represent your query results.
Select Map Visualization: From the drop-down options, select Map. This option enables you to display the geographical distribution of failed RDP login attempts based on the latitude and longitude data extracted in your query.
Configure Map Settings: Once you’ve selected the map visualization, you may need to configure additional settings to ensure the map displays the data accurately.
Location Data: Ensure that the latitude and longitude fields are correctly mapped to the map’s geographical coordinates.
Final Result
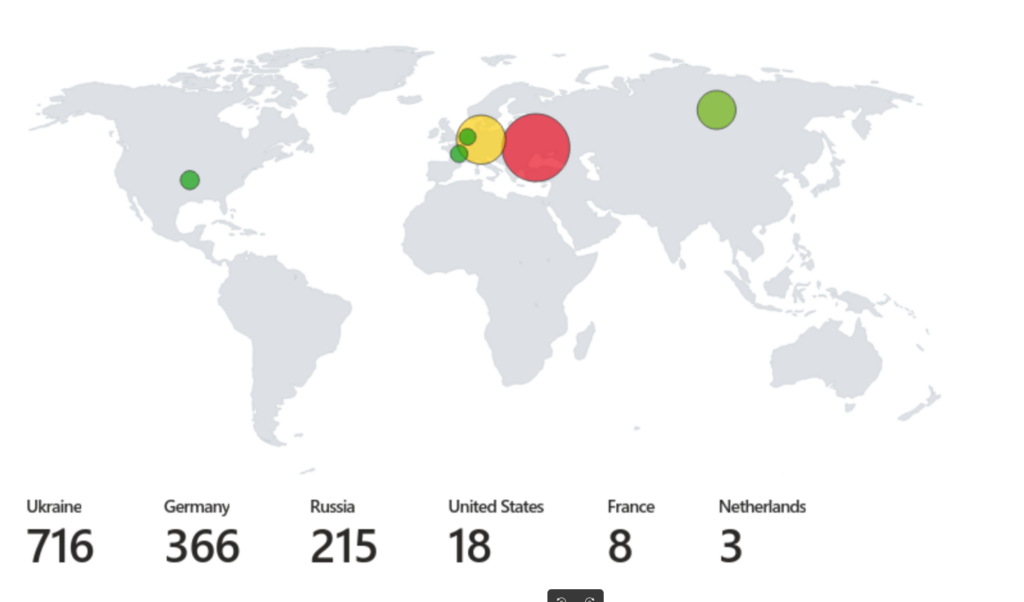
After executing the query and visualizing the output on a map, we obtained the following insights regarding failed RDP login attempts:
- Total Attempts:
- Ukraine: 716 attempts
- Germany: 366 attempts
- Russia: 215 attempts
- USA: 18 attempts
- Netherlands: 3 attempts
- France: 8 attempts
This distribution of failed login attempts reveals significant activity from specific regions, particularly:
Other Regions: The remaining attempts from the USA, Netherlands, and France were significantly lower, indicating less activity or interest from these regions in the failed login attempts.
Ukraine and Germany: The high number of failed attempts from these countries suggests the possibility of brute force attacks. This could indicate malicious actors attempting to gain unauthorized access to the system.
Final Thoughts
This lab was a fascinating experience, providing valuable insights into the dynamics of cybersecurity and the importance of robust authentication practices. Through this exercise, I was reminded of the critical need to choose strong and unique usernames and passwords.
While reviewing the logs, it became evident that many of the brute force attempts targeted generic usernames, such as “admin,” “administrator,” and “aduser.” This highlights the vulnerability associated with using easily guessable credentials.
In light of this, I urge everyone to remain vigilant about their login practices. Employing strong passwords, utilizing multi-factor authentication, and avoiding common usernames can significantly enhance security and mitigate risks from potential attacks.


